The first time I used the Fry readability graph, I was sitting with a stack of old textbooks, trying to guess which ones were “too hard” for the students in front of me. I felt like I was gambling. Some pages looked fine to me, but when the students tried to read, they froze halfway through a paragraph. That’s when I realized that judging readability by “gut feeling” doesn’t work.
The Fry readability graph gave me a way to measure text difficulty without overthinking it. I could take 100 words, count the syllables, count the sentences, and plot them on the chart. And suddenly, I had an answer. It didn’t tell me everything, but it gave me a starting point that was far better than guessing.
In this article, I’ll walk you through the Fry readability graph the way I wish someone had explained it to me back then.
Table of Contents
What You’ll Learn Here
- What the Fry readability graph is and why it exists.
- How the formula works in simple steps.
- How to read the chart without confusion.
- Practical ways teachers, writers, and professionals can use it.
- How does it estimate reading ages?
- Where to find calculators that make it easier.
- Its strengths and weaknesses are compared with other formulas.
- FAQs answered in plain, short sentences.
What Is the Fry Readability Graph?
The Fry readability graph is a chart created by Edward Fry to measure the grade level of English text using sentence length and syllable count.
Fry wanted a way for teachers to quickly decide if a book or passage was suitable for their students. Instead of long math formulas, he gave them a simple chart. By plotting average sentence length against average syllables per 100 words, the graph shows the grade level of a text.
It’s different from the Flesch Kincaid Reading Ease because instead of giving you a single number, it shows you a band on a graph. Personally, I like that visual cue —it makes readability less abstract.
How the Fry Formula Works
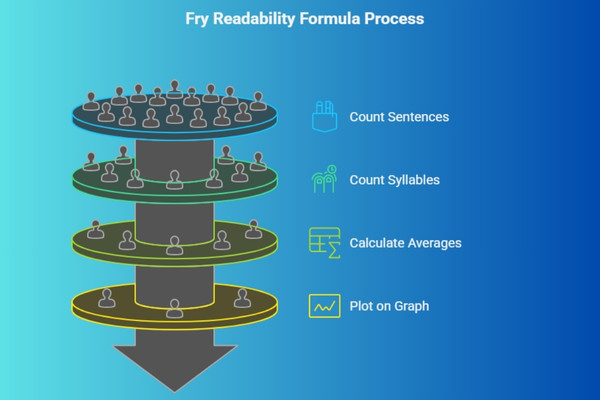
You select three 100-word samples, count sentences and syllables, then average them to plot on the graph.
Here’s the step-by-step process I follow:
- Pick three random 100-word passages from your text.
- Count the number of sentences in each sample. A half sentence counts as 0.5.
- Count the total syllables. Words like “continental” are split into four.
- Find the average sentences per 100 words.
- Find the average syllables per 100 words.
- Plot the point on the Fry readability graph.
Example: If I test a piece of writing and find about 12 sentences and 145 syllables per 100 words, the graph will show a grade 6–7 level. That means middle school students should be able to follow it comfortably.
It reminds me of cooking. The recipe looks strange when you first read it, but once you actually measure and stir, you end up with something you can taste. The Fry formula works the same way: measure, plot, interpret.
How to Read a Fry Readability Graph
The x-axis is syllables per 100 words, the y-axis is sentences per 100 words, and their intersection shows the grade level.
The chart has a horizontal axis for syllables and a vertical axis for sentences. Each box on the chart represents a grade-level range.
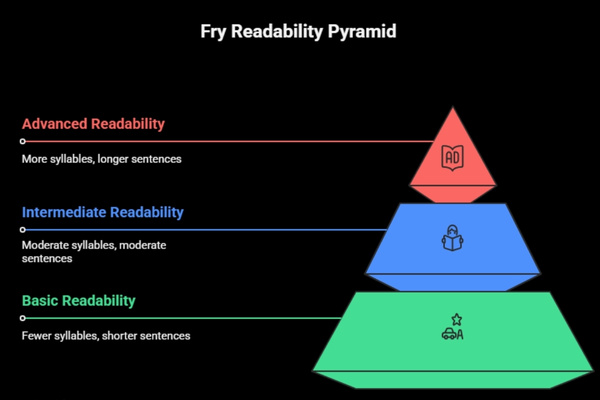
- Fewer syllables + shorter sentences = lower grade level.
- More syllables + longer sentences = higher grade level.
When you place your averages on the graph, the box they land in gives you the grade level. It’s that simple.
If you’re testing technical writing, you’ll land in higher boxes. If you’re testing children’s books, you’ll end up on the lower side of the chart.
How to Use the Fry Graph in Practice
Teachers, writers, and professionals use it to match text to readers’ abilities.
Here’s how I’ve seen it applied in different situations:
- Teachers: They test new books or assignments to make sure the reading level matches their class. No one wants to give 5th graders a book at a grade 9 level.
- Writers: I’ve used it myself to check if my explanations were too dense. For example, when I write test methods, I’ll run them through Fry to see if I can simplify. This connects directly to the question, “How can I improve the readability of my test methods?” The answer: shorten sentences, cut extra syllables, and check again.
- Professionals: Companies often test manuals, onboarding guides, or training material. If it scores too high, employees may struggle.
That’s why I like this graph. It’s a simple check to make sure your text won’t intimidate your reader.
Fry Graph for Estimating Reading Ages
Each grade level on the Fry graph roughly equals a child’s age in school years.
For example:
- Grade 3 → 8 to 9 years old.
- Grade 6 → 11 to 12 years old.
- Grade 9 → 14 to 15 years old.

This is especially useful for children’s publishers or teachers building a reading list. If a book plots at grade 4, you instantly know it’s best for kids around 9 years old.
I’ve also used this logic when editing marketing copy. If the Fry graph told me grade 12, I knew I had to cut complexity because my audience wasn’t only college students.
Modern Fry Readability Calculators
Online calculators can do the plotting automatically, saving you time.
You don’t always need paper and pencil anymore. Tools like the Readability Test Tool can run the Fry formula instantly. Just paste in your text, and it tells you the grade level.
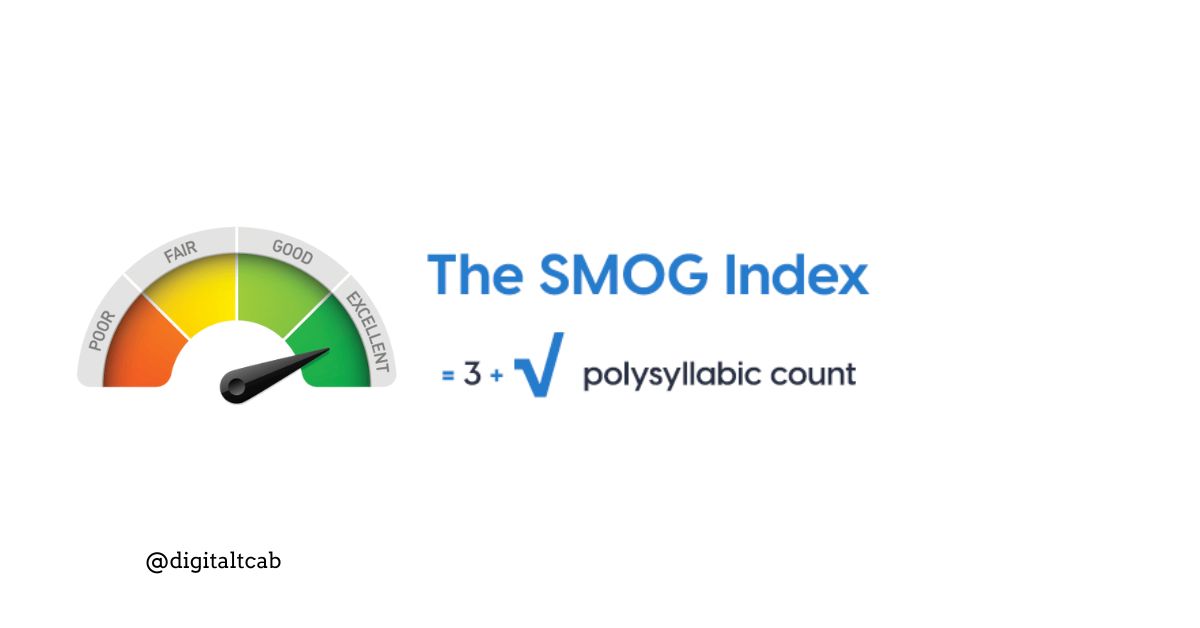
Manual plotting is still good if you want to learn the method, but in real life, I almost always use calculators. They’re faster, and they let me compare Fry with other formulas like SMOG Index or the Automated Readability Index.
Advantages and Limitations of the Fry Graph
It estimates readability well, but it doesn’t measure meaning or context.
The Fry graph is accurate within about one grade level, which is good enough for classroom or workplace use. But it only looks at sentences and syllables. It doesn’t check if the words are familiar, if the reader knows the background, or if pictures support understanding.
That’s why I often combine Fry with other formulas. For example, the Gunning Fog Score looks at complex words, while the Coleman-Liau Index works with characters instead of syllables. Each one gives a slightly different lens.
In practice, Fry is like a compass. It points you in the right direction, but you still need a map to see the whole landscape.
FAQs
Does the Fry readability graph accurately reflect grade level?
Yes, usually within ±1 grade. It’s a solid estimate, but not perfect.
How is the Fry graph helpful to teachers?
It helps teachers choose books and assignments that match their students’ reading ability.
How to read a Fry readability graph?
Count syllables and sentences in 100-word samples, average them, plot on the graph, then read the grade level.
How to use a Fry readability graph today?
Either manually with the chart or automatically with a readability calculator.
What is the purpose of the Fry readability graph?
Its purpose is to estimate the grade level and scanning age of English text.
Conclusion
When I look back, I smile at how nervous I was about using the Fry readability graph the first time. It didn’t seem very easy on paper, but in practice, it took me ten minutes and gave me clarity I couldn’t get by guessing.
The graph won’t tell you everything. It doesn’t know if your readers are motivated, distracted, or experts in the subject. But it gives you a reliable benchmark, and for me, that’s been a game-changer.
If you’ve never tried it, grab a short passage of your writing, run it through a Fry readability calculator, and see what comes out. You might be surprised. Sometimes what feels “easy” to us looks very different on the chart.
And that’s the beauty of it: a straightforward graph can help you write for the people who matter most, your readers.


Leave a Reply